

Figure 1: Conceptual illustration of fiber-to-the-home (FTTH) connectivity
FTTx Last Mile fiber-optic links (glowing lines) run along streets, railways, paddocks and waterways, into residences, delivering gigabit-speed service directly from central networks to homes and businesses. In practice, laying these last-mile fibers involves extensive planning and labor – often making this segment the most expensive part of a deployment [1]. Real-world rollouts must navigate complex terrain, right-of-way constraints, and labor-intensive installation processes that simple graphics only hint at.
Global adoption of fiber-based broadband (FTTx, including FTTH/B) is advancing rapidly, driven by insatiable demand for speed and capacity. According to the FTTH Council, 21 countries now report over 50% household FTTH/B penetration [2]:
Europe’s leaders (e.g. Spain ~78.9% coverage) are catching up, and the global FTTH market is projected to grow from about $25.1 billion (2023) to $54.7 billion by 2030 (CAGR ~11.8%) [3]. These figures underscore massive investment but also highlight the uneven fiber landscape: many developing regions still lack basic broadband. For example, less than 40% of households in most developing countries subscribe to any broadband [4], and billions remain unserved by fiber – reflecting a persistent digital divide. Governments are responding with major funding programs (U.S. BEAD/RDOF, Canada’s $2.75B Universal Broadband Fund, etc.) to spur rural and underserved fiber buildouts [5]. However, these initiatives must contend with entrenched deployment challenges before the promised networks can materialize.
North America shows both progress and gaps. In the U.S., carrier and municipal fiber projects have pushed access to roughly 56% of households by mid-2023[6]. Yet adoption remains lower: for example, New York State has ~78% fiber availability but only ~11% of homes subscribing [6]. Overall U.S. broadband stats suggest only about 15–17% of subscribers use FTTH (vs. 60–80% using cable/DSL) [7]. This lag is partly due to competition from cable/HFC and to the cost of building fiber into every home. Growth is expected to accelerate – 2024 saw a record 13% increase in homes passed, adding about 8.4 million new households [8] – aided by federal funding (e.g. the 2021 Infrastructure Law’s BEAD and RDOF programs) and private investment.
Canada has similarly ambitious targets: its Universal Broadband Fund aims for 98% coverage by 2026[5]. Historically Canada lagged the U.S. in FTTH penetration (just a few percent in the early 2010s), but recent projects (e.g. city-wide builds) and subsidies have spurred rapid expansion. By contrast, Mexico and other parts of the Americas trail these leaders, so North American averages mask wide regional disparities.
Across the continent, key challenges are similar: suburban and rural areas require extensive trenching or aerial work (often with high make-ready costs on utility poles), while dense urban cores involve navigating existing infrastructure (ducts, rights-of-way) and coordinating among multiple providers, whereas in Europe a lot of the infrastructure needs to be deployed as service provider neutral to reduce overprovisioning. These factors, combined with strict service-level expectations from consumers, mean that North America still has one of the most expensive and time-consuming “last mile” buildouts per household in the world [1].
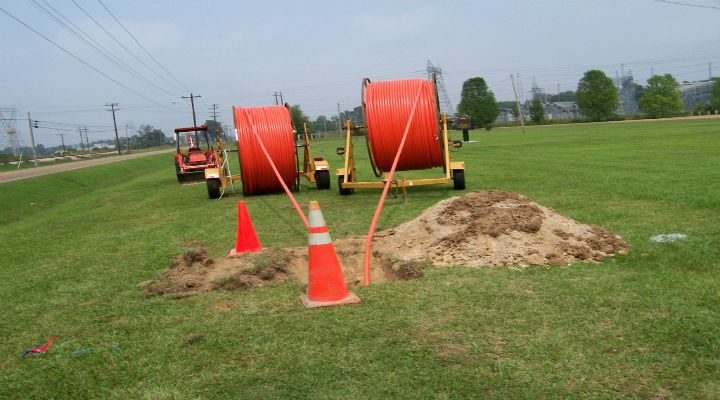
Figure 2: Field deployment of fiber-optic cable.
Large cable reels and trenching equipment are staged for burying fiber in a suburban area. While such specialized machinery (cable blowers, trenchers, air compressors) can speed installation, they come with very high cost and logistical overhead. For example, fiber-cable blowing machines cost on the order of $15–$20 thousand each, require gasoline compressors (~$8–$10K), and take hours to set up for each new drop [12]. Labor to move this equipment (and then splice or terminate the fiber) must be repeated for every service connection, so each home added can involve a full day of skilled labor. In short, manpower and equipment costs dominate last-mile budgets [16][12].
Taken together, these barriers make the last mile the most expensive and time-consuming part of FTTx rollouts [9]. Global firms note that even with increased funding and demand, “no simple way” exists to get fiber into every home – each drop requires bespoke work [9]. It is in this environment of high costs, tight schedules, and complex site work that the industry sees an urgent need for smarter, standardized approaches.
To overcome these obstacles, the telecom industry is emphasizing advanced, interoperable components and streamlined practices. Central to this is standardization and modularity. Fiber connectors (LC, SC, MPO, etc.) and distribution hardware are increasingly designed to fit together seamlessly across vendors, enabling multi-vendor networks that avoid lock-in. For instance, manufacturers now offer factory-installed, non-splice connectors and hardened plug-in drop cables that installers can deploy like electrical wiring. As one industry reference notes, these “field-installable” pushable fiber assemblies “speed deployment and reduce costs by eliminating labor in the field” [14]. Multi-fiber MPO solutions, in particular, allow an entire fiber bundle to be connected in one action, significantly cutting connectorization time. Similarly, plug-and-play splitters and multiport service terminals are used to pre-configure passive optical networks, reducing on-site splicing.
In parallel, smaller crews and tools are being sought. Techniques like micro-trenching and self-contained trenchers produce minimal disturbance and faster installation. Pre-connectorized cable reels and pre-loaded ducts let installers pull cable without splicing at the drop. Inside homes, manufacturers have developed compact drop-boxes and universal ONT mounts to simplify the final hookup. A recent product brochure highlights “no-splice, plug-and-play cables and connectors [that] make it quick and simple to install” in FTTx applications [15]. Even passive enclosures are designed with pre-installed splice trays and adapters, so technicians need only plug in and secure fiber cords rather than perform field welding. These advances reduce the skill threshold: crews can be trained on a handful of standardized parts and procedures, mitigating the splicer shortage.
Finally, better planning and management tools are helping reduce time to market. High-resolution mapping of buildings and ducts (using satellite imagery or LIDAR) allows precise route planning before a shovel hits ground [4]. Automated workflow software and integrated GIS systems also streamline permitting and design. While these do not replace boots-on-the-ground work, they cut the engineering hours required per project. Industry associations note that every 10% increase in household broadband coverage can translate to a ~1% bump in GDP [4], underlining the broad payoff of efficient deployment solutions.
In summary, the final 100 meters of fiber – the infamous “last mile” – remains a major bottleneck for global FTTH efforts. But by adopting plug-and-play, multi-vendor architectures and by rethinking installation methods, operators can shrink costs and speed rollouts. Analysts agree that the fusion of new funding with these smarter deployment practices is expected to fuel record fiber buildouts in 2025 and beyond [16][8]. As the telecom industry pivots toward these interoperable, installer-friendly systems, the goal is clear: to connect every home to high-speed fiber in a reliable and cost-effective way, enabling the next generation of digital services for customers worldwide.
There is no such thing as having the right connectivity solution for every FTTx Last Mile scenario, it is important to have a partner that understands the challenges and thinks about solutions not just from a CAPEX perspective but also from a deployment and OPEX perspective, while ensuring interoperability and standard compliance.
Sources: Industry reports and market analyses on fiber deployment, including the Fiber Broadband Association’s annual cost studies, government broadband reports, and technical publications. (All data cited above are drawn from the cited references.)